Case study · Our own site
Eleven brand pages from one keyword map: a Dutch menu-price site
One long page split into 11 brand pages from a 2,214-keyword map: impressions from 40.1K to 151K in a month.
735 → 1.42K
Clicks, 1 to 28 September vs 1 to 28 October 2026
40.1K → 151K
Impressions over the same two periods
2,214
Keywords mapped to pages before anything was written
The starting point
A Dutch site comparing fast-food and restaurant menus and prices, built in September 2026 on a new domain.
Established competitors with many referring domains, and a first version that put every restaurant on one long page with anchor links, so no single brand had its own page to rank.
What we did
- Audited the main competitor and ten others, and merged their keyword exports into one map of 2,214 relevant keywords, after removing off-topic terms from recipe sites.
- Turned the single restaurants page into 11 dedicated brand pages, including three brands no competitor covered well.
- Gave each page an FAQ section with matching FAQPage schema, and checked that the schema text matched the visible text on every page.
- Created the sitemap and robots file, and verified Search Console with an HTML tag when DNS verification was not possible.
- Turned question-style searches into FAQ answers on the matching brand page instead of thin standalone articles.
The numbers
| Period | Dates | Clicks | Impressions | Average position |
|---|---|---|---|---|
| First full month | 1 to 28 September 2026 | 735 | 40.1K | 7.7 |
| Latest month | 1 to 28 October 2026 | 1.42K | 151K | 7.6 |
Source: Google Search Console, web search, read 1 November 2026.
Search Console
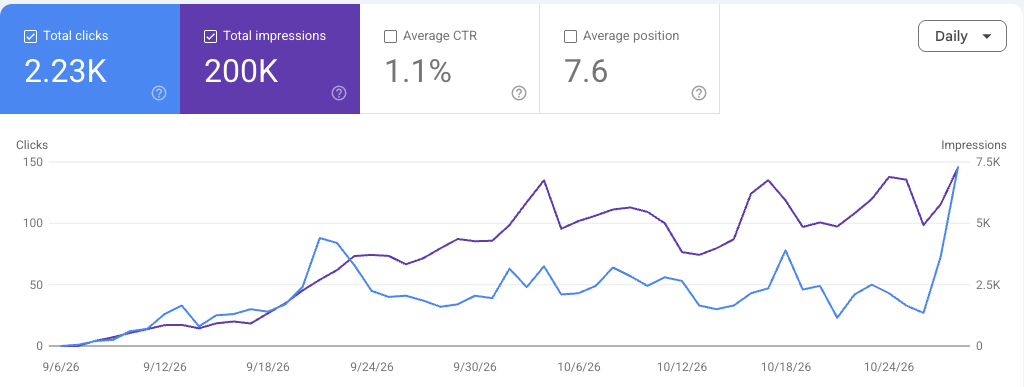
How to read the chart.
The chart at the top of this page is a screenshot of the Search Console Performance report, cropped so the domain does not show. Nothing else is edited.
- Blue line: clicks from Google search each day.
- Purple line: impressions, the number of times the site appeared in results.
- Average position: where the site appeared on average, across every search it showed for. Lower is better. The number can get bigger while traffic grows, because the site starts appearing for more, and harder, searches.
What the numbers do not prove
Our own site. Clicks rose more slowly than impressions: click-through fell from about 1.8% to 0.9%, so the next gain is in titles and descriptions, not more pages.
What we would do differently
Do not launch content hubs before the articles exist. At launch, three hub pages listed 16 teaser articles that linked nowhere, which wastes a visitor’s click and Google’s crawl.
More results
Other case studies.
Client site, anonymised
Local SEO for a personal-trainer course provider in Edinburgh
A new local business with no search history: website, Business Profile, UK directories and on-page fixes, then four times the impressions.
Read itOur own site
Fixing copied content: 84 to 908 clicks a month on a German price site
Google crawled the site but refused to index it. The cause was copied text, and the rewrite took clicks from 84 to 908 a month.
Read itOur own site
A brand-new menu site: 472 clicks in its first full month
A new domain registered in September: from 17 clicks in its first weeks to 472 in its first full month.
Read itStart with clarity
Want the same approach on your site?
Request a focused opportunity review. We’ll identify the clearest technical, content, or conversion gap and explain what to do next.
Prefer to hire through Upwork? Hire me on Upwork
- No generic pitch
- Actionable first step
- Reply within one business day